Impact Metrics: Sectoral Physical Intensities
Read our latest data brief to learn more about sectoral physical intensities, and why and how these should be used for transition finance.

March 2025
The transition towards a sustainable, Earth-positive economy creates significant opportunities for innovation and investment. However, these opportunities also come with challenges for financial institutions (FIs) to determine their credibility and net-zero alignment, including accessing quality data and understanding complex decarbonization pathways, and tailoring expectations for companies operating in different sectors and regions.
This brief explores the role of physical intensity metrics as an increasingly significant suite of indicators to address these challenges. Using CDP data to answer questions around the availability of these metrics and how they are measured, it provides insights on existing market practices that inform recommendations, to ensure that FIs have relevant data needed to scale transition finance.
Among the indicators available to FIs, physical intensities – such as tons of greenhouse gas (GHG) emissions emitted per megawatt-hour (MWh) power generated – emerge as vital to identify efficiency gains and compare company performance in high-emitting sectors. Unlike absolute emissions that require at least two years of data to allow for a trend assessment, physical intensities enable point in time assessments of a company’s performance against a benchmark [1].
Regulatory and voluntary sustainable finance frameworks increasingly rely on physical intensity metrics – Table 1 below outlines several such use cases:
Use case | Example and details |
|---|---|
Target setting and assessment of progress against targets | Science Based Targets Initiative [2] – Sectoral Decarbonization Approach (SDA) The SDA is a target setting method for real economy companies and for FIs that uses the convergence of emissions intensities. Under the SBTi approach, it is the only applicable method available for some asset classes. |
Prudential disclosures | European Banking Authority [3] – Pillar 3 Disclosures on ESG risks In relation to climate transition risk, banks are required to disclose alignment metrics that cover physical intensity-based metrics for the sectors on their books. |
Access to sustainable finance | International Capital Markets Association (ICMA) – Voluntary Process Guidelines for Issuing Sustainability-Linked Bonds (SLB) Corporates looking to access sustainable finance are guided to select KPIs that underscore the credibility of that finance. ICMA’s KPI Registry outlines various options for sector-specific physical intensity metrics that are suggested as potential core metrics for the SLB. |
Sustainable finance taxonomies | Jurisdictional examples include the EU Taxonomy and Singapore-Asia Taxonomy, market-led examples include the Climate Bonds Taxonomy Physical intensity metrics are used for the threshold values accepted as part of the technical screening criteria that underpin an assessment of whether a given activity is aligned to a taxonomy. |
Emissions trading systems | European Trading System (ETS) The ETS uses physical intensities to build the sectoral benchmarks for free carbon allowances. |
For companies, these metrics help to credibly track and communicate progress toward meeting emissions reduction targets, and enable access to sustainable finance in the process. For FIs, this data enables sector-specific assessment of the alignment of their clients against net zero pathways and helps meet emerging regulatory and supervisory requirements.
As FIs look to provide transition finance and meet their own climate portfolio targets, physical intensities serve as vital tools to underpin credibility through their adoption within sustainability-linked products and frameworks. For example, Standard Chartered – whose steel sector targets are based on physical intensities – provided a US$25 million transition trade finance facility for a prominent Asian steel company, enabling a shift to scrap-based electric arc furnace production.
Comparability in measurement and disclosed data
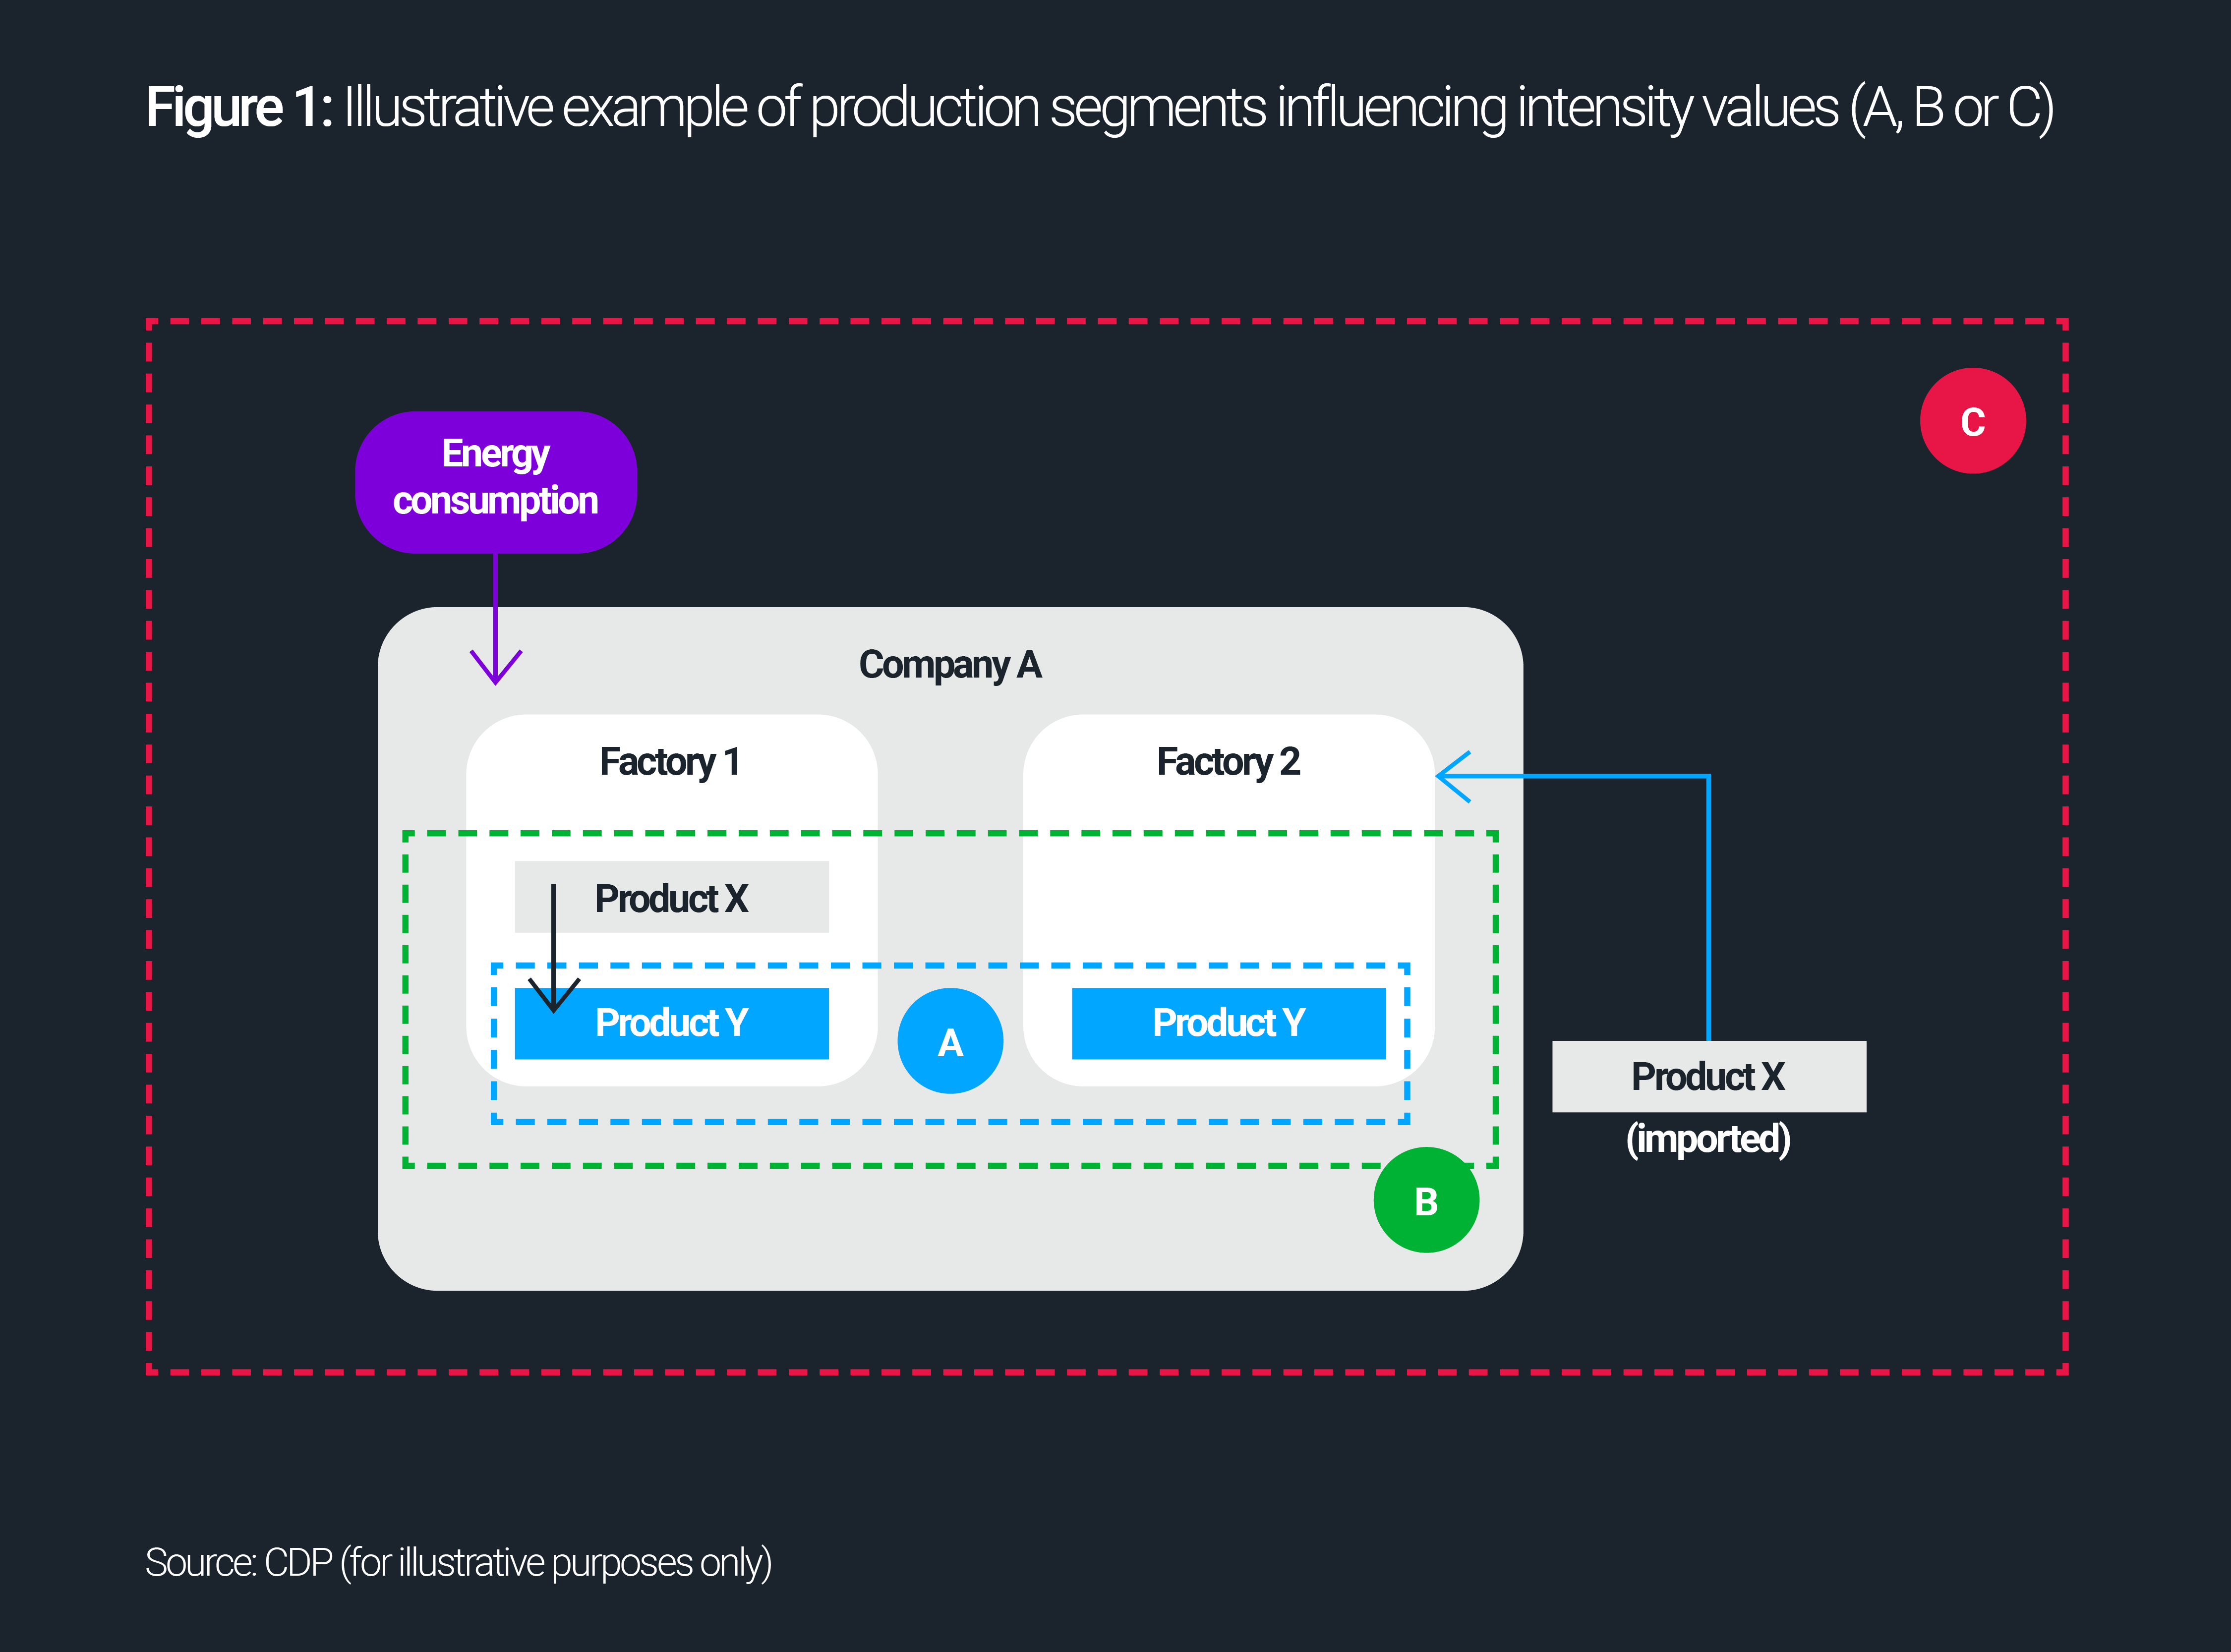
Whilst the concept behind physical intensities is straightforward, their measurement varies depending on carbon accounting methods and use cases (see Figure 1). Data users should keep these considerations in mind when interpreting numbers.
Additionally, physical intensities are only relevant for economic activities that generate homogenous outputs, such as power generation, transportation, cement, real estate, steel/iron and aluminum – unlike food products, for example. For industries with standardized outputs, intensity metrics can be mapped to scenarios like those from the International Energy Agency (IEA) [4], that provide detailed long-term trajectories for key variables. Examples of variables include MWh, tons of cement, passenger kilometer (pkm) for passenger transportation, and square meters for real estate.

Sector-specific questions drive more usable disclosures of physical intensity metrics
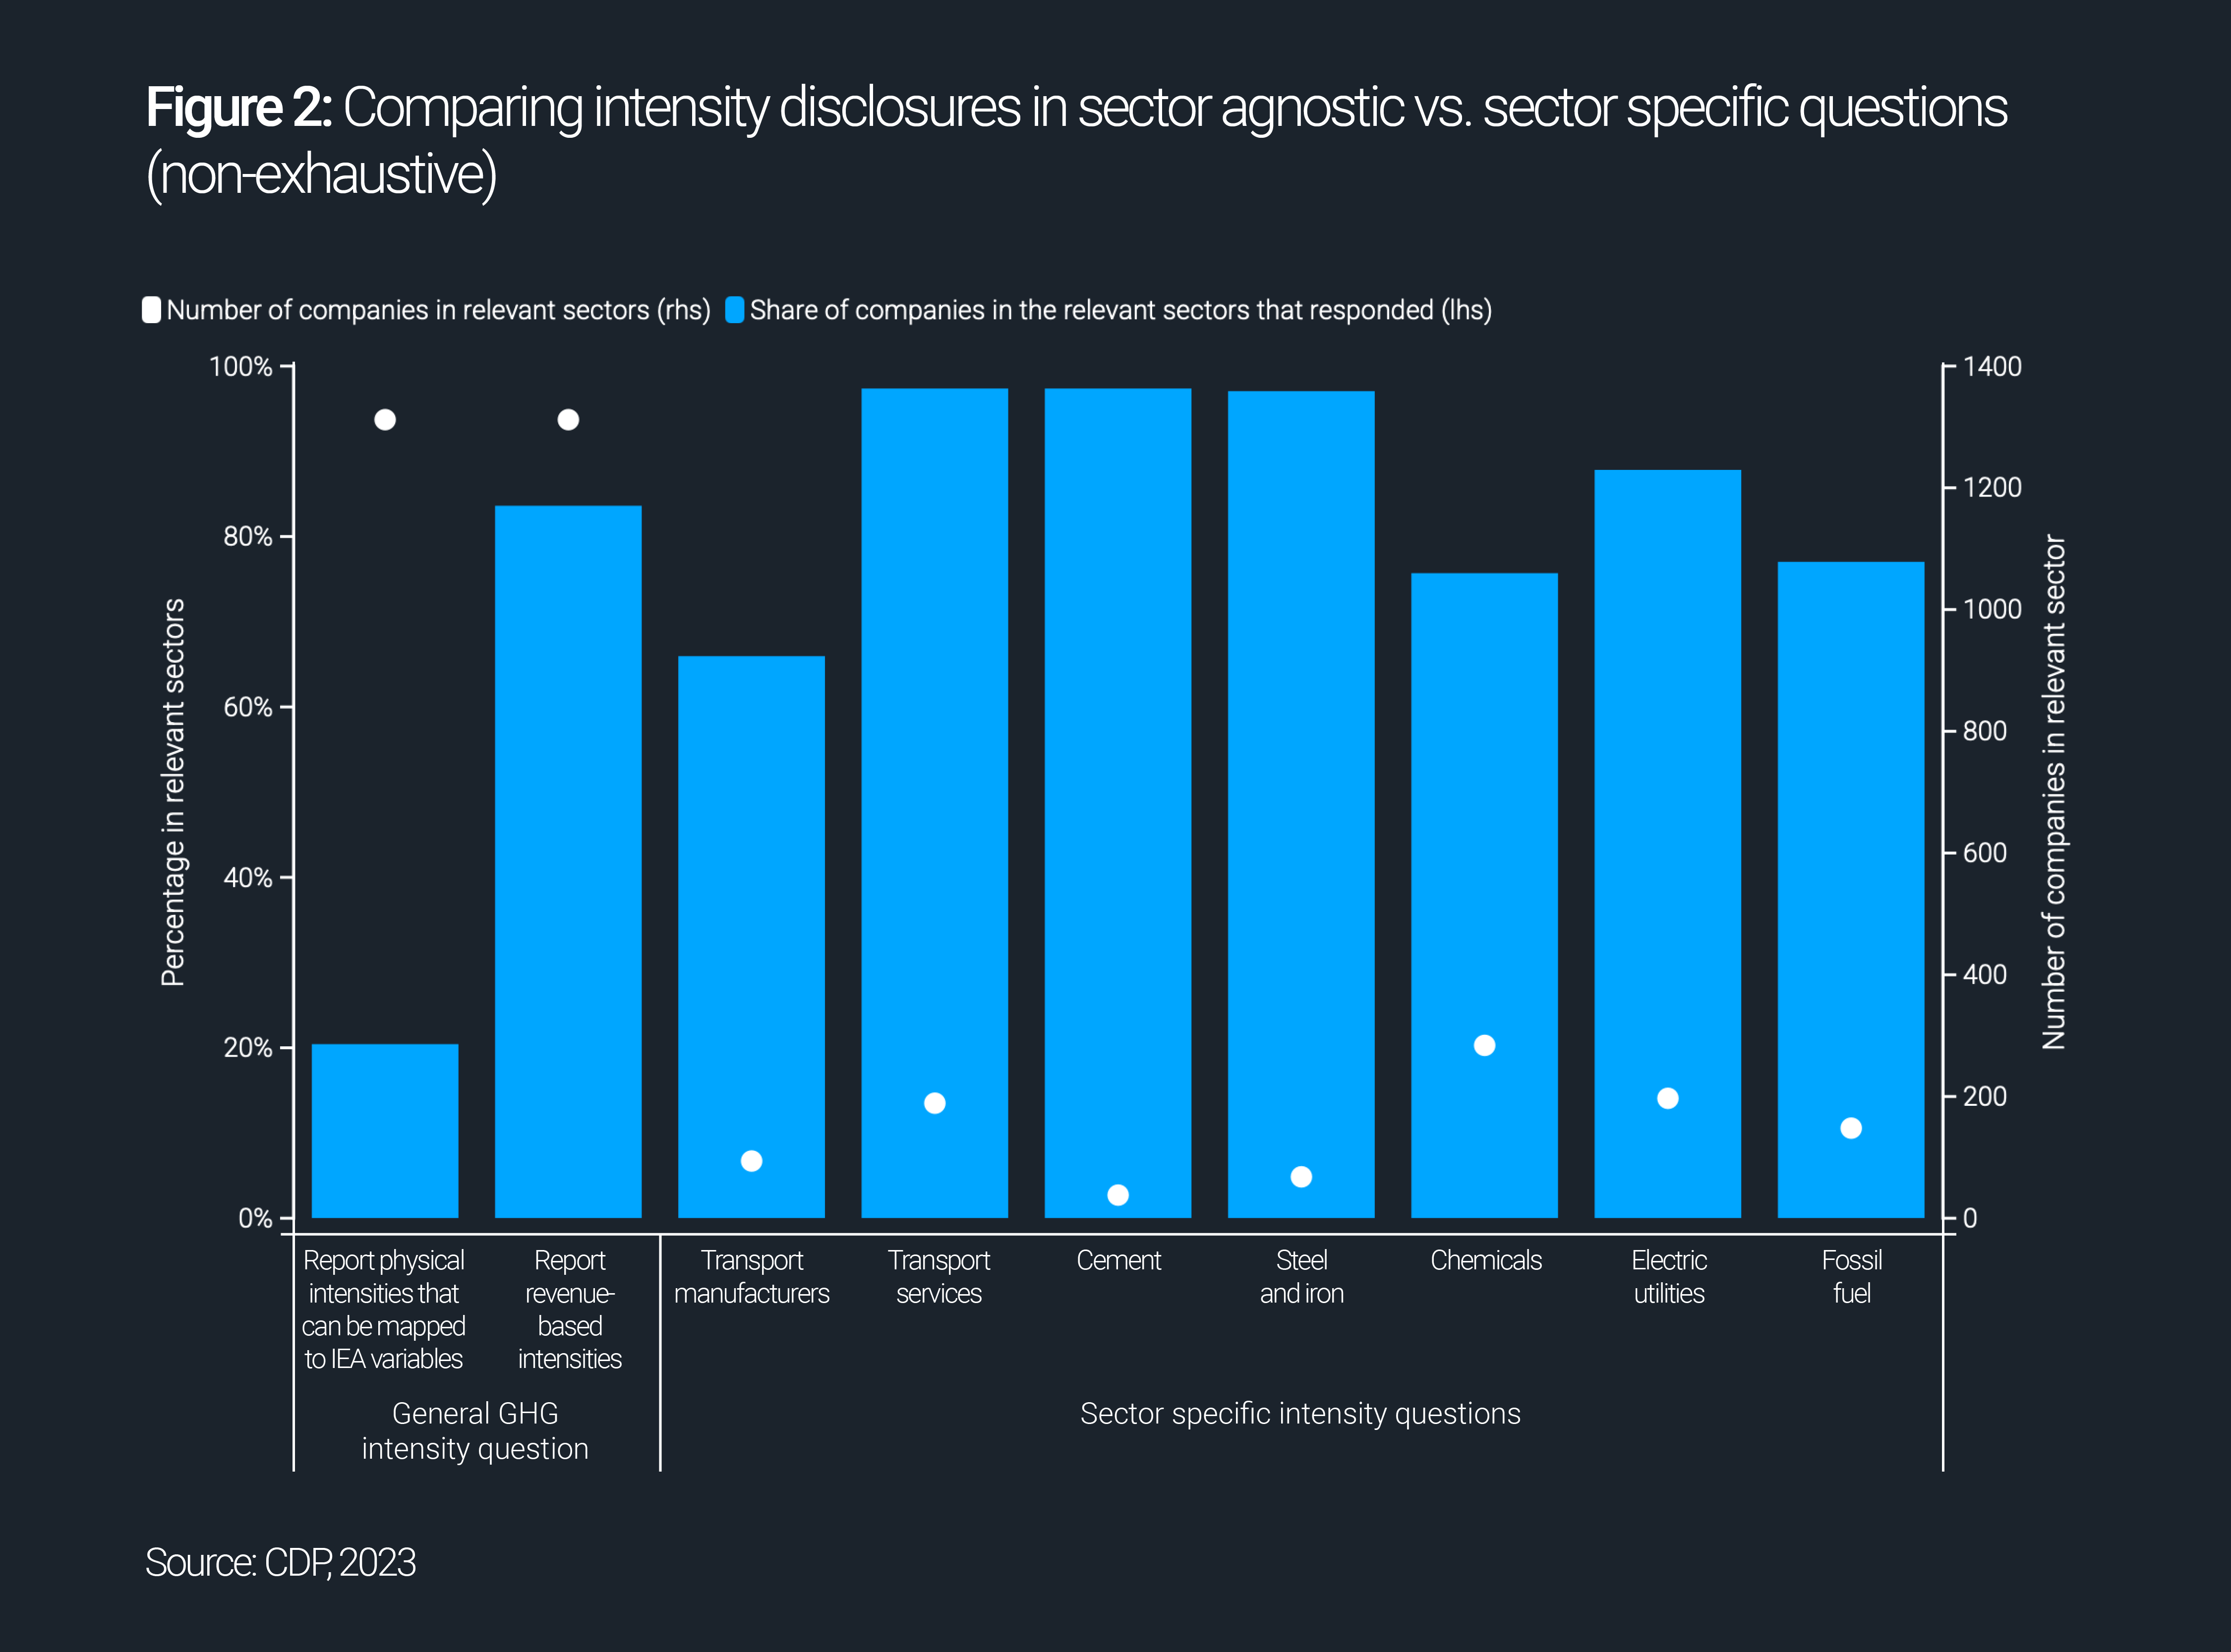
An analysis of voluntary disclosures through CDP in 2023 from over 5,700 large and/or listed companies highlights the need to harmonize entity-level physical intensities reporting, and the importance of sector-specific standards. When high-emitting companies are asked to report GHG intensities without specific guidance, less than 20% report using relevant metrics that can be mapped to IEA. Instead, companies rely on denominators such as emissions per number or cost of full-time employees. However, when sector-specific questions are used, 60% to 98% of companies in the given sector report using the appropriate intensity metric.

Physical intensities vs revenue-based intensity metrics
A common practice is to use financial metrics, such as revenue, to create GHG intensity ratios. However, metrics dependent on prices tend to be much more volatile than those based on physical outputs, making them less accurate for benchmarking company performance against the mitigation variables within scenarios. Given this and the fundamental link to physical production, physical intensities are most appropriate to inform sector-specific analysis.
Using physical intensities for target setting
Physical intensity metrics can be used by companies whilst setting intensity-based emission reductions targets and to track their progress accordingly. This approach prevents companies with the least GHG-intensive production processes from being penalized for increasing their absolute emissions if they gain market share against lower performing companies. The most GHG-intensive sectors across the economy should decarbonize according to sector-specific emission trajectories in net-zero scenarios, to reflect the pace and efficiencies of their sectors.
CDP data shows that over a quarter of companies report having intensity-based targets. However, less than half of these (11%) have intensity targets using denominator metrics that can be mapped to IEA variables [5]. Without standardized approaches, it is difficult for data users, including FIs, to compare companies to peers within their sectors.
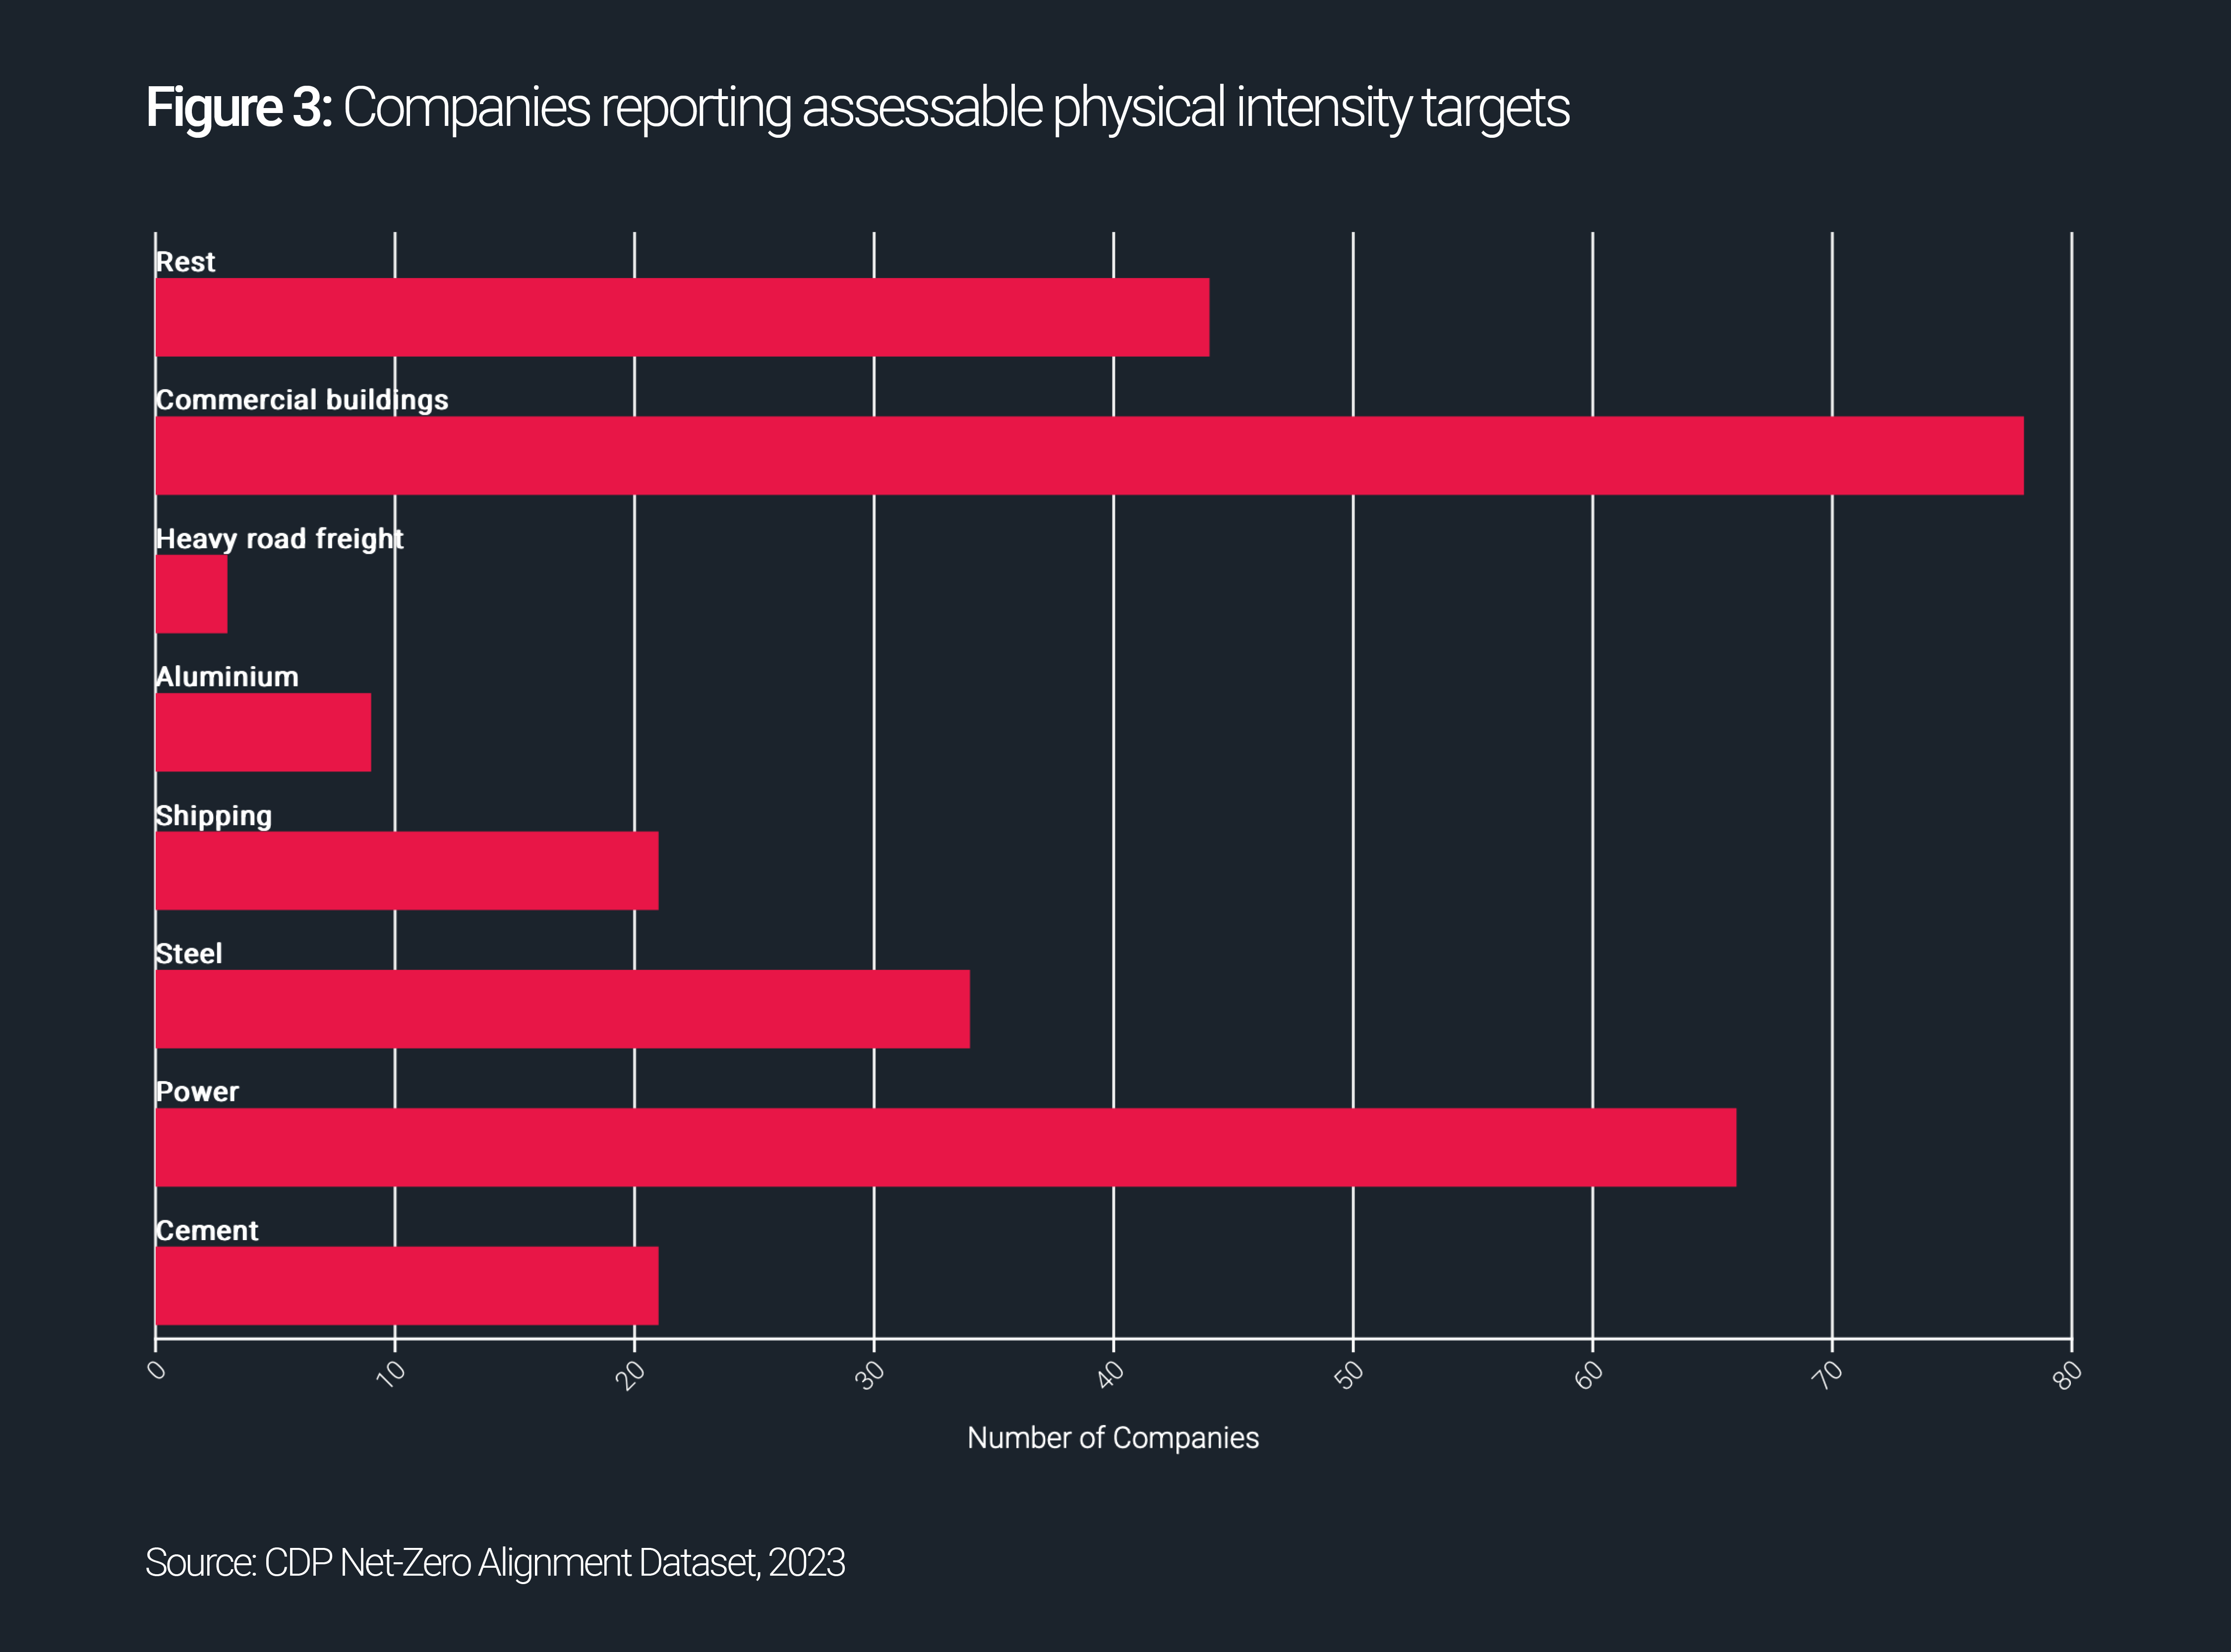
Screening further for companies with valid targets [6], analysis shows that only 276 companies – or 5% of companies – disclose an intensity-based target that can be effectively assessed against a sectoral pathway following certain target quality criteria. While this share increases when adjusting for sectoral relevance, progress is still needed to ensure that companies are setting comparable, quality targets suited to their sectors.

Under current disclosure standards such as the European Sustainability Reporting Standards (ESRS), GHG intensities are often required in revenue terms, or companies can choose the most relevant metric for their activities. The evidence suggests that official sectoral guidance on reporting physical intensity metrics is needed to improve overall data comparability and usability.
In use: Assessing physical intensities against sectoral pathways
Direct or indirect emissions?
Sectoral pathways from sources like the IEA usually include all direct emissions from a given sector, meaning raw materials, intermediary products and final goods. For example, in the cement industry, emissions cover not only cement and its derivates like concrete, but the intermediary carbon intensive binders necessary to create cement – like clinker – are included in the total emissions inventory and projections for the sector. To assess a company in this use case, the sectoral cement pathway should be compared to the emissions (as shown in Figure 1, intensity value B), adjusted by the total tons of cement produced by the company.
Building physical intensity benchmarks from mitigation scenarios
For some highly energy-intensive sectors, indirect emissions play a central role in their transition. Alongside sourcing greener secondary energy, these sectors also need to reduce their secondary energy consumption through efficiency measures. While sectoral pathways typically include only direct emissions, best practice suggests also including indirect emissions for certain sectors when assessing corporate action.
For example, as outlined in the table below, the CDP Net-Zero Alignment Dataset (NZAD) uses the following units and numerators for sector-specific pathways, covering different emission scopes. Several scenario sources are used to enable sensitivity analysis when assessing corporate alignment to 1.5°C [7].
Sector | Unit | Numerator |
|---|---|---|
Power generation | tCO2e/MWh | Scope 1 |
Aluminum, cement, pulp and paper, iron and steel | tCO2e/tons of production | Scope 1 + 2 |
Aviation (passengers), heavy road freight, maritime freight (shipping), rail freight | gCO2e/RPK (passenger), gCO2e/RTK (freight) | Scope 1(Tank-to-Wheel) |
Commercial real estate | kgCO2e/m2 | Scope 1 + 2 |
For sectors that have Scope 3 as their main source of emissions – such as fossil fuel and automobile manufacturers – identifying the right intensity pathway can be challenging. As the demand and supply of fossil fuels as primary energy are projected to decrease altogether in most 1.5°C-aligned scenarios, a pathway reflecting absolute emissions from fossil energy use is often more relevant than an intensity metric to assess fossil fuel companies’ Scope 3 emissions performance.
Example: Assessing companies in the power generation sector
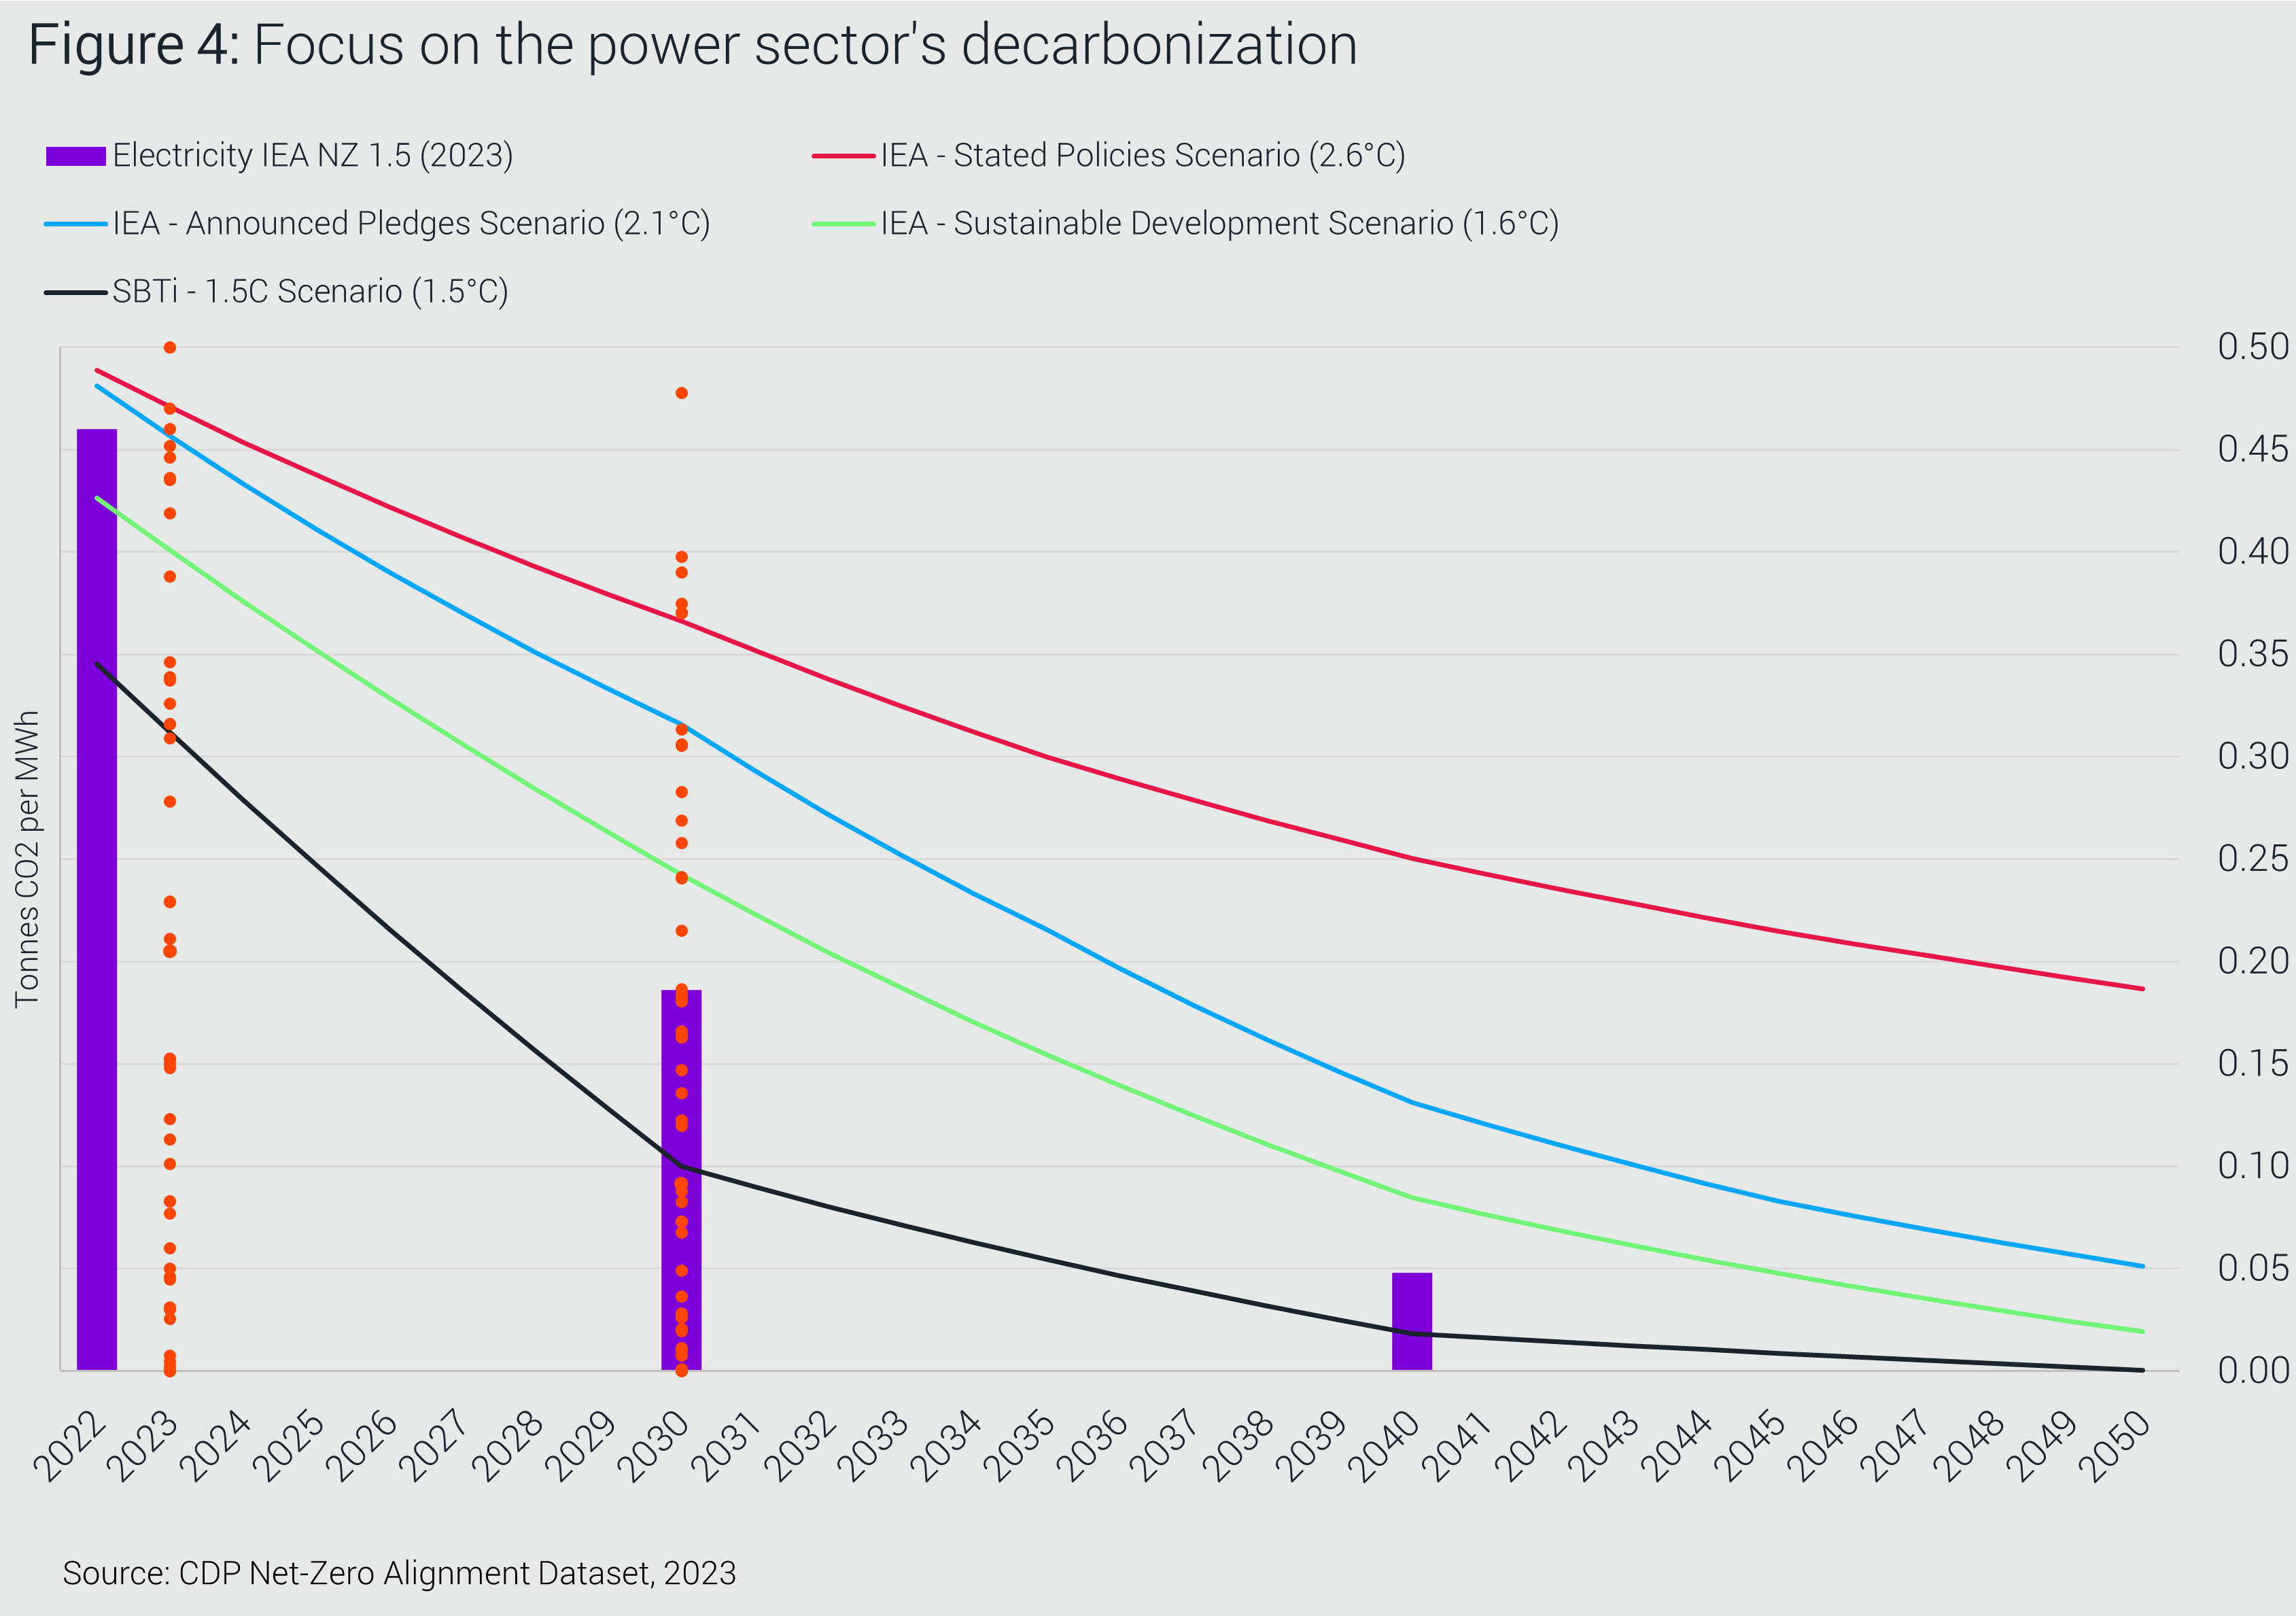
From the perspective of FIs and data users seeking to understand the performance and trajectories of their portfolio companies, Figure 4 analyzes the physical intensity data and targets reported by companies in the power generation sector to evaluate their current deviation from a set of benchmarks [8].

View larger version of graphic
Out of the 59 companies in the power sector analyzed for this brief with an assessable intensity-based target, half currently have physical intensities (tCO2e/MWh) below the benchmark required for 1.5°C alignment for their sector (as of 2023). Looking ahead to their 2030 targets, still half (29) of the companies are aiming to reach below the 150kg of CO2e/MWh threshold implied by the IEA Net Zero Emissions scenario (2021 vintage).
Granular sector-specific pathways are needed to incentivize transition finance
Further analysis of companies exceeding benchmark values – both for current intensities and 2030 targets – shows that most of them are headquartered in Asia and Latin America (eg India, China, Japan, Brazil) and produce coal power. While using sectoral emissions trajectories is becoming a common market practice, there are regional disparities to consider.
This underscores the growing need for granular, jurisdiction-specific sectoral decarbonization pathways and roadmaps which can enable more accurate assessments of companies during portfolio alignment exercises and prior to deploying transition finance.
Conclusion and recommendations
Companies are already using and disclosing physical intensity metrics on their transition to a net zero future. These metrics can be valuable inputs for the assessment of transition progress by FIs, as they implicitly account for the technological assumptions behind mitigation pathways. Technological progress enables high-impact sectors to decarbonize while continuing to grow, through efficiency measures and access to cleaner energy sources.
However, these metrics are complex and context-dependent. Disclosures by companies in relevant sectors need to be mainstreamed to enable their effective use. This requires the adoption of sector-specific standards that prescribe common metrics, along with capacity-building and engagement to inform companies as to how and why they should disclose and use these metrics. Currently, a very limited number of the companies setting intensity-based targets can effectively be benchmarked to net-zero pathways. FIs can play a key role in driving the adoption of comparable intensity-based targets and the disclosure of their associated metrics.
Finally, the publishing of more granularity in scenarios – such as accounting for regional differences, and providing activity-specific roadmaps – would significantly improve the assessment of companies’ progress and the credibility of their commitments and targets.
The following recommendations could improve the comparability and usability of entities’ disclosures of physical intensity metrics, particularly for transition finance:
Actor | Key recommendations |
|---|---|
Companies | Report relevant sectoral physical intensity metrics in addition to absolute emissions, and ensure transparency regarding the relevant GHG scopes that are covered. |
Financial institutions | Assess companies in high emitting sectors using relevant benchmarks and physical intensity metrics. Engage with companies to disclose assessable physical intensity metrics where relevant. Acknowledge potential regional differences and characteristics of activities and goods produced. |
Policymakers and international organizations | Enable standardized reporting of entity-level physical intensity metrics to complement facility-level product information. Improve the usability of scenarios for application in the private sector by standardizing the publication of granular information and projections for sub-sectors where available. |
Moving forward, CDP will continue to:
Explore how its question bank can capture suitable, standardized metrics to support FIs as they continue to deploy transition finance and themselves transition towards net-zero;
Support its requesting authorities, including 700+ Capital Markets Signatories – representing over US$142 trillion in assets – to access and utilize data disclosed by thousands of companies through CDP and complement these with a suite of other CDP metrics to inform their financial decision-making processes, and to underpin sustainable finance products;
Enhance the provision of primary reported data by supporting companies on their journey of reporting maturity, to disclose usable physical intensity metrics; and
Further develop its work on transition finance in a new report ahead of COP30, focused on emerging efforts to credibly enable and unlock transition finance for transitioning entities, both by private finance and the public sector.
Net-Zero Alignment Dataset
Planning to use physical intensity metrics and other key datapoints, as a financial institution?
Learn more about the NZAD, one of CDP's datasets that informed this brief. You can also request access to CDP data.
Footnotes
In this brief the terms benchmarks, pathways, scenarios and trajectories are used interchangeably. They are all technical terms that can have nuanced definitions but refer usually to the long term predicted evolution of a set of variables such as emissions, energy demand, population, GDP. These are built using various models and can include sectoral breakdowns that build on sector-specific technological assumptions.
SBTi – Financial Sector Near-Term Science-Based Targets Explanatory Document
European Banking Authority - Annex II - Instructions for ESG prudential disclosures templates
IEA scenarios are often used as trusted benchmarks to evaluate the performance of a sector against what is feasible to achieve to reach net-zero energy related carbon emissions. Several mitigation variables are provided over five-year time intervals until 2050, including energy demand and supply per energy source, cement production, kilometres travelled by passenger cars and their associated emissions.
This percentage excludes companies that set intensity targets in revenue terms for the reasons outlined earlier in this section.
Using the criteria for target validation outlined in the CDP-WWF Temperature Scoring Methodology.
Scenarios sources often used include SBTi, IEA, OECM, NGFS.
As the analysis presented in Figure 4 focuses on the power sector, the benchmarks include only Scope 1 (direct) emissions. The sectoral decarbonization approach assumes a convergence of all companies to the intensity level implied by a net-zero scenario.
Important information for website users in Europe only
Funded by the European Union. Views and opinions expressed are however those of the author(s) only and do not necessarily reflect those of the European Union or CINEA. Neither the European Union nor the granting authority can be held responsible for them.
CDP Europe gratefully acknowledges EU funding support.

Co-funded by the Horizon 2020 programme of the European Union.